Open any card on OrcaRouter‘s cyber tier and read the p95 row. Nine of the eleven show 10,000 ms for the seven days to 2026-11-15 [OURS]. Kimi K3.1 Pro, Qwen3.8 Flash Next, GLM 5.3 Flash, GLM 5.3, MiMo V2.6 Flash, Hy4, Zero 1.0, Zero 1.5 and Ultra 1.0 all carry the same figure, on cards whose medians range from 1,695 ms to 7,459 ms.
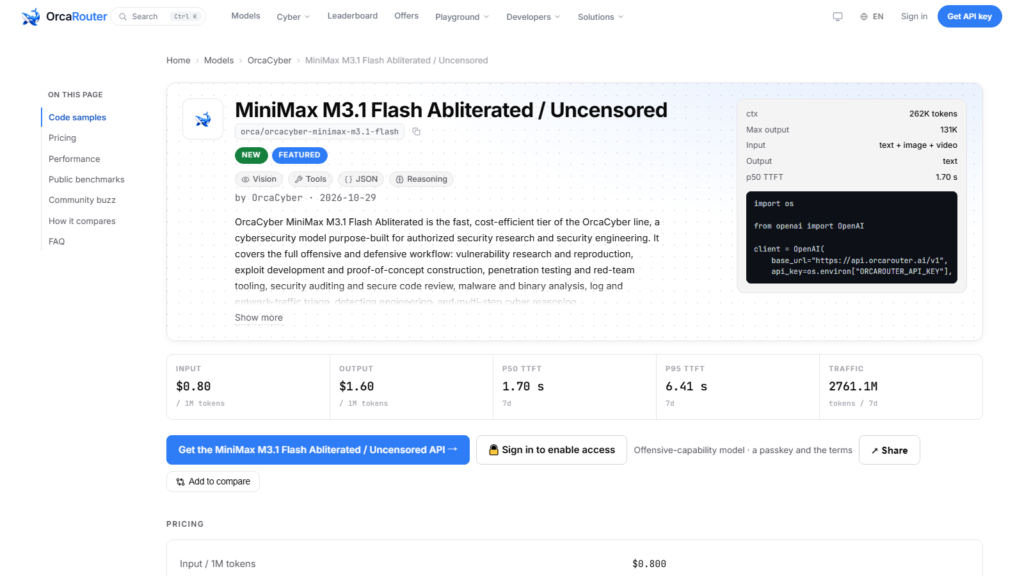
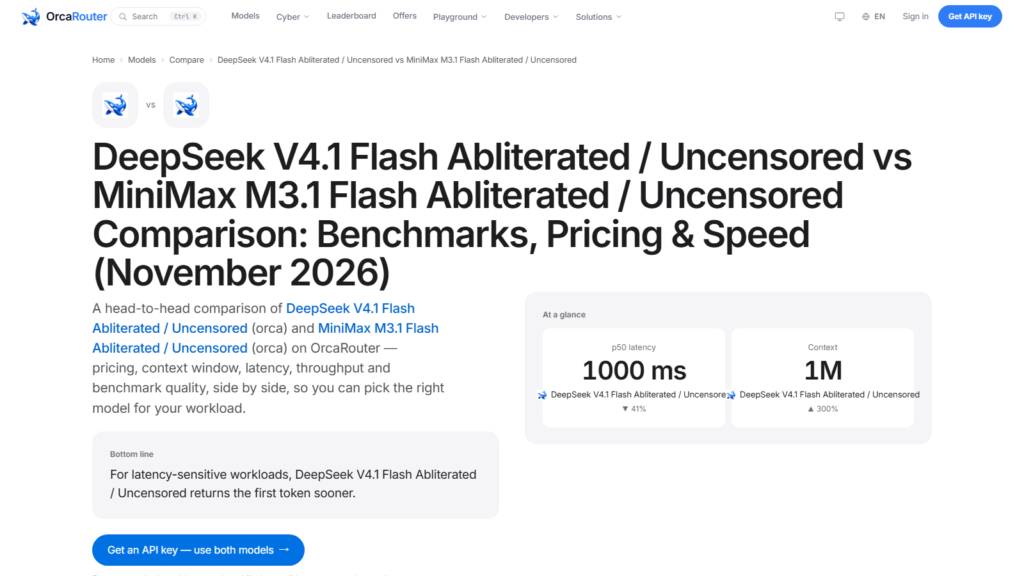
Only two cards sit below it: DeepSeek V4.1 Flash at 8,938 ms and MiniMax M3.1 Flash at 6,429 ms.
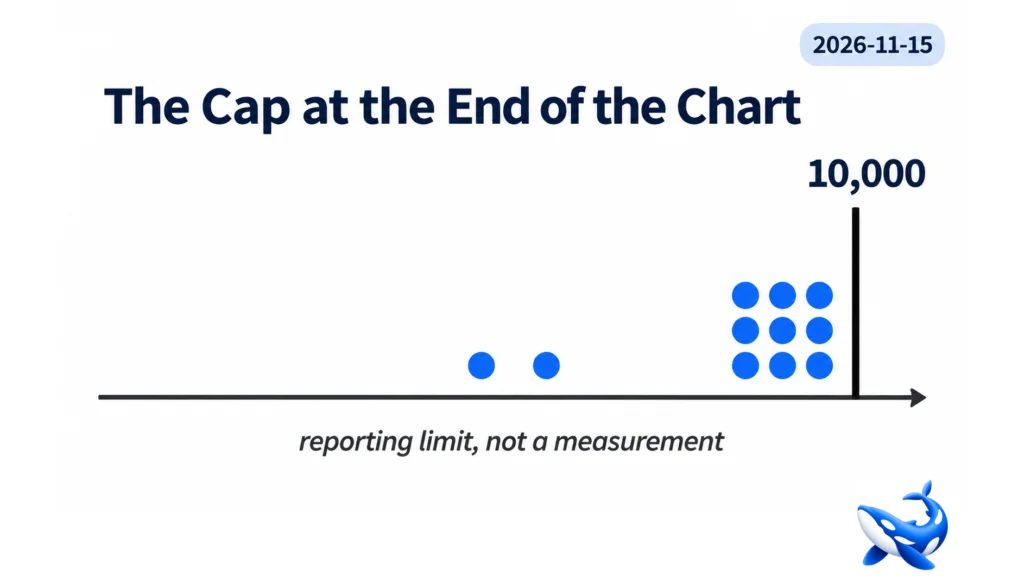
Ten seconds is not a coincidence, and it is not a measurement. It is where the harness stops waiting.
What a cap does to a tail
A percentile is computed from the requests that completed. If the harness abandons a request at ten seconds and records it as ten seconds, then any true tail beyond that point is folded back into the distribution at exactly 10,000.
Two things follow, and they pull in opposite directions.
The p95 becomes a ceiling rather than a reading. A card whose actual p95 would be 14 seconds and a card whose actual p95 would be 40 seconds both report 10,000 ms. They are indistinguishable in that cell, and the difference between them is exactly the thing a tail measurement exists to reveal.
The median stays honest. Medians are unaffected by truncation at the far end — folding the tail to 10,000 cannot move a value that sits below it. That is why the median is the row to trust on these cards and the p95 row is not.
Why nobody prints the cap
Because the honest alternative is a blank cell, and a blank cell in a comparison table looks like a missing feature rather than a missing measurement.
There is also a real argument for the cap: a p95 computed only over completed requests would be biased low, favouring the slowest cards, since the slowest requests are the ones that never finish. Reporting the cap as the value is a conservative choice. It is just a choice that makes nine cards look identical.
The number that would actually separate them is the share of requests that hit the cap. None of the cards publishes it [OURS].
The two cards that can be read
MiniMax M3.1 Flash’s 6,429 ms p95 against a 1,695 ms median is a tail roughly four times the middle. The card serves fast and fails fast — when a request goes wrong it is abandoned well inside the window rather than dragging.
DeepSeek V4.1 Flash’s 8,938 ms against 998 ms is a nine-fold ratio, and it is the more interesting shape. Its median is the lowest in the tier by a wide margin, so most requests are answered in under a second, and one in twenty lands somewhere in the eight-to-ten-second band.
That combination — very fast middle, long tail — is what a card looks like when it is absorbing a queue. Short requests are served immediately; the long ones wait behind something. Measured across the week, the daily medians tell the same story: 914, 1,416, 1,093, 1,031, 895, 910 and 1,126 ms [OURS].
What the cap hides in the base checkpoints
The same ten-second ceiling shows up on the base side and makes two comparisons unusable.
Qwen3.8 Flash’s base checkpoint reports 10,000 ms p95 and, in the same payload, an output rate of 2,112.8 tokens per second [OURS]. No card in this tier sustains four figures of throughput; the number is the arithmetic of a few very short completed responses divided by a very short elapsed time, with everything else truncated away.
MiMo V2.6 Flash’s base reports 10,000 ms and 60.595% errors over the same window [OURS]. Sixty per cent of requests failing and the survivors all landing at the cap is not a serving profile; it is an endpoint that was mostly unavailable.
Quoting either figure beside the abliterated card built from that checkpoint would produce a favourable comparison that means nothing. The cards’ own rows are better than their bases’ — that much is real. The size of the gap is not.
How to measure the tail yourself
Three options, in increasing order of effort.
Read the daily medians instead of the weekly p95. Seven numbers cannot be truncated at the top, and a median that moves day to day is a card with a queue that moves day to day. MiniMax’s series — 1,698, 1,715, 1,696, 1,729, 1,588, 1,727, 1,646 — is the flattest in the tier, and that stability is worth more than any single p95 could tell you.
Run your own timeout. A 30-second client timeout on a card whose harness abandons at ten will show you the share of requests that never came back, which is the number the cap conceals.
Compare the error rate against the p95. A card at 0.166% errors and an 8,938 ms tail is abandoning almost nothing and returning slowly. A card at 16.110% errors is returning errors, not slow responses, and the tail row is measuring the wrong failure.
The timeout you should actually set
A client timeout is a bet about the distribution, and the cards’ own numbers tell you how to size it.
For DeepSeek V4.1 Flash, whose p95 is 8,938 ms and whose median is 998 ms, a 10-second client timeout would reproduce the harness exactly: you would abandon the same requests it abandons and see the same shape. A 30-second timeout would let the tail complete and tell you how much of the 8,938 is real waiting versus abandonment.
For the nine cards at the cap, a timeout under ten seconds changes the measurement rather than reading it. If the harness gave up at ten and your client gives up at five, you are testing a different endpoint than the one in the table.
For MiMo V2.6 Flash, whose median is 7,459 ms, a 10-second timeout is one and a third medians — which means roughly two requests in five would be cut off simply for being normal. That is the card where the timeout decides the experience more than any other row does.
Set the timeout from the median, not from the p95. The p95 tells you what happens when something goes wrong; the median tells you what happens when nothing does, and the second is what your users spend their day in.
The short version
Nine of eleven cards report a p95 of exactly 10,000 ms. That is the harness abandoning requests, not a serving time, and three of those nine have medians above three seconds — where the tail and the middle start to converge and the cap matters least.
Two cards can be read: MiniMax at 6,429 ms and DeepSeek at 8,938 ms. Of the two, DeepSeek’s shape is the more useful signal, because its 998 ms median proves the fast path is real and its tail proves the queue is too.
Treat every p95 in this tier as a bound. If a vendor deck quotes one, ask what share of requests hit it.
Sourcing note: prices, context windows, output ceilings, modalities, quality scores, latency, throughput, error rates and traffic are read from the eleven cards’ public model data on 2026-11-15, with seven-day windows ending that day [OURS]. A p95 of 10,000 ms is the reporting cap on this harness, not a measured latency, and is described as such throughout. Benchmark rows are OrcaCyber’s own and dated where quoted [VENDOR].